Operational Dashboards
Executive and floor-level dashboards for tracking throughput, turnaround time, production volume, service capacity, backlog, and operational performance.
Business Intelligence for Operations lol
Strantell helps operations-driven businesses turn scattered spreadsheets, manual reports, and hidden process data into decision-ready dashboards, KPI systems, and performance visibility.
Sample Deliverable
Strantell dashboards are designed to give leaders a clear view of performance, bottlenecks, turnaround time, quality issues, and the metrics that drive daily decisions.
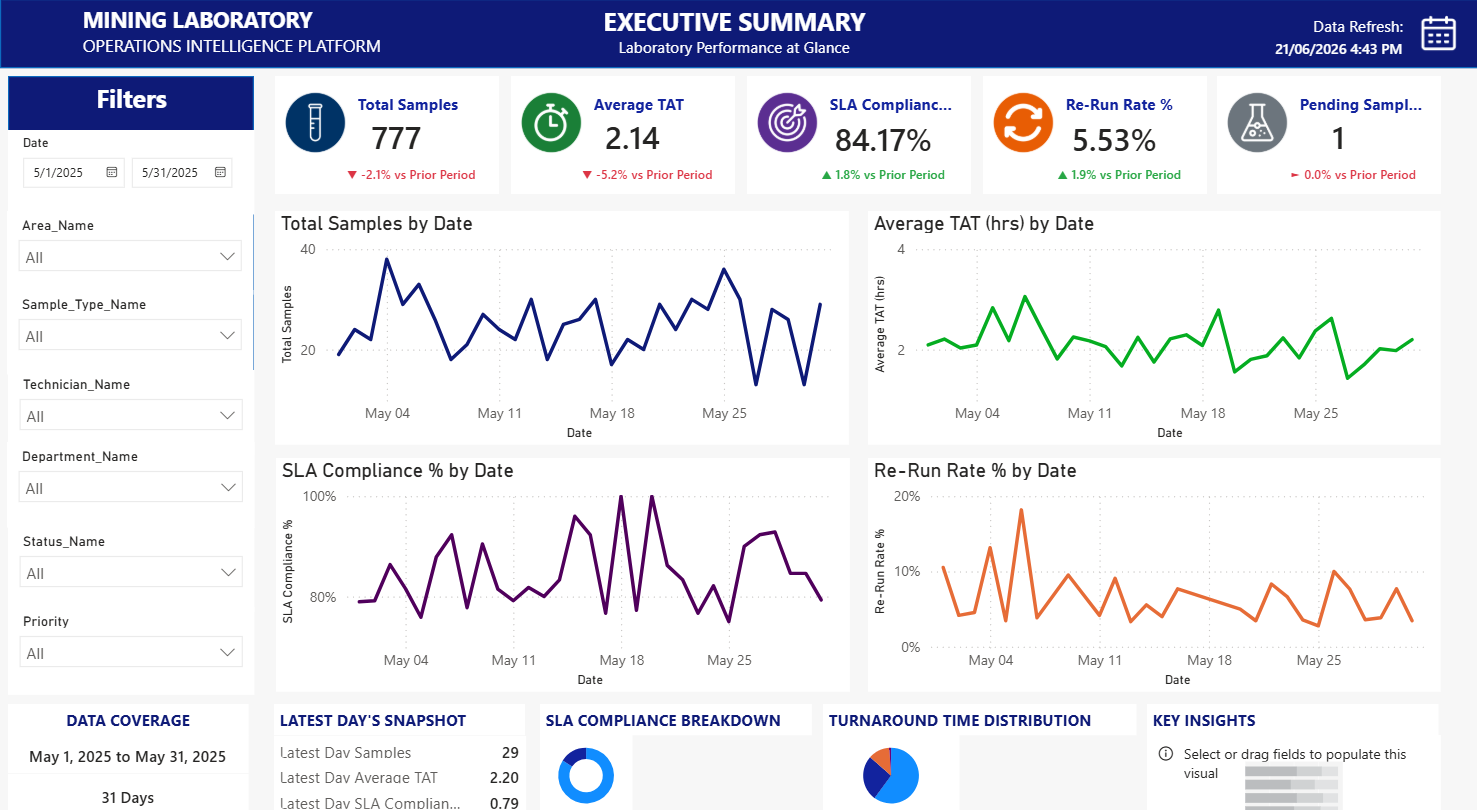
Mining Laboratory Operations Intelligence Platform
This sample dashboard consolidates sample volume, average turnaround time, SLA compliance, re-run rate, pending samples, date trends, filters, and executive summary KPIs into one operational view.
What We Build
Executive and floor-level dashboards for tracking throughput, turnaround time, production volume, service capacity, backlog, and operational performance.
Replace fragile manual reporting with structured KPI definitions, recurring reports, clean data models, and decision-ready metrics.
We map how information moves through your business, identify bottlenecks, and recommend practical BI improvements before building anything.
Our Process
Useful business intelligence starts by understanding the real workflow: where work enters, where it slows down, who needs visibility, and which decisions are being made without reliable data.
Understand the process, teams, handoffs, reports, and operational pain points.
Clarify what should be measured, why it matters, and who needs to act on it.
Create dashboards, data models, reporting workflows, and documentation.
Help teams use the system consistently so reporting turns into better decisions.
Where Strantell Fits
Start With Visibility
Strantell can begin with a focused operational data assessment and turn it into a practical roadmap for dashboards, reporting, and KPI systems.