Manual Reporting
Managers spent time reviewing records instead of interpreting operational performance.
Synthetic Portfolio Case Study
A complete business intelligence workflow for a production-support mining laboratory: kickoff documentation, data preparation, star schema modeling, Power BI KPI development, weekly project reporting, and executive findings.
Business Problem
The laboratory relied on manually reviewed sample records, spreadsheet-based reporting, and informal operational visibility. As sample volume increased, leadership had limited ability to identify turnaround issues, monitor SLA compliance, track re-runs, or understand whether delays were concentrated by department, instrument, sample type, technician, or area.
Managers spent time reviewing records instead of interpreting operational performance.
SLA compliance, turnaround time, and re-run activity were difficult to monitor consistently.
Operational delays were hard to isolate by instrument, department, area, or sample type.
What Strantell Built
This case study demonstrates the full delivery path of an operations analytics engagement: clean the data, model it properly, build the dashboard, and translate the findings into management action.
Cleaned laboratory sample records, timestamps, SLA rules, priorities, statuses, and categories.
Built a star schema with fact and dimension tables for reliable Power BI reporting.
Created KPI cards, filters, trend views, SLA visuals, and bottleneck analysis views.
Prepared kickoff, weekly progress, and executive findings documents for a realistic engagement.
Dashboard
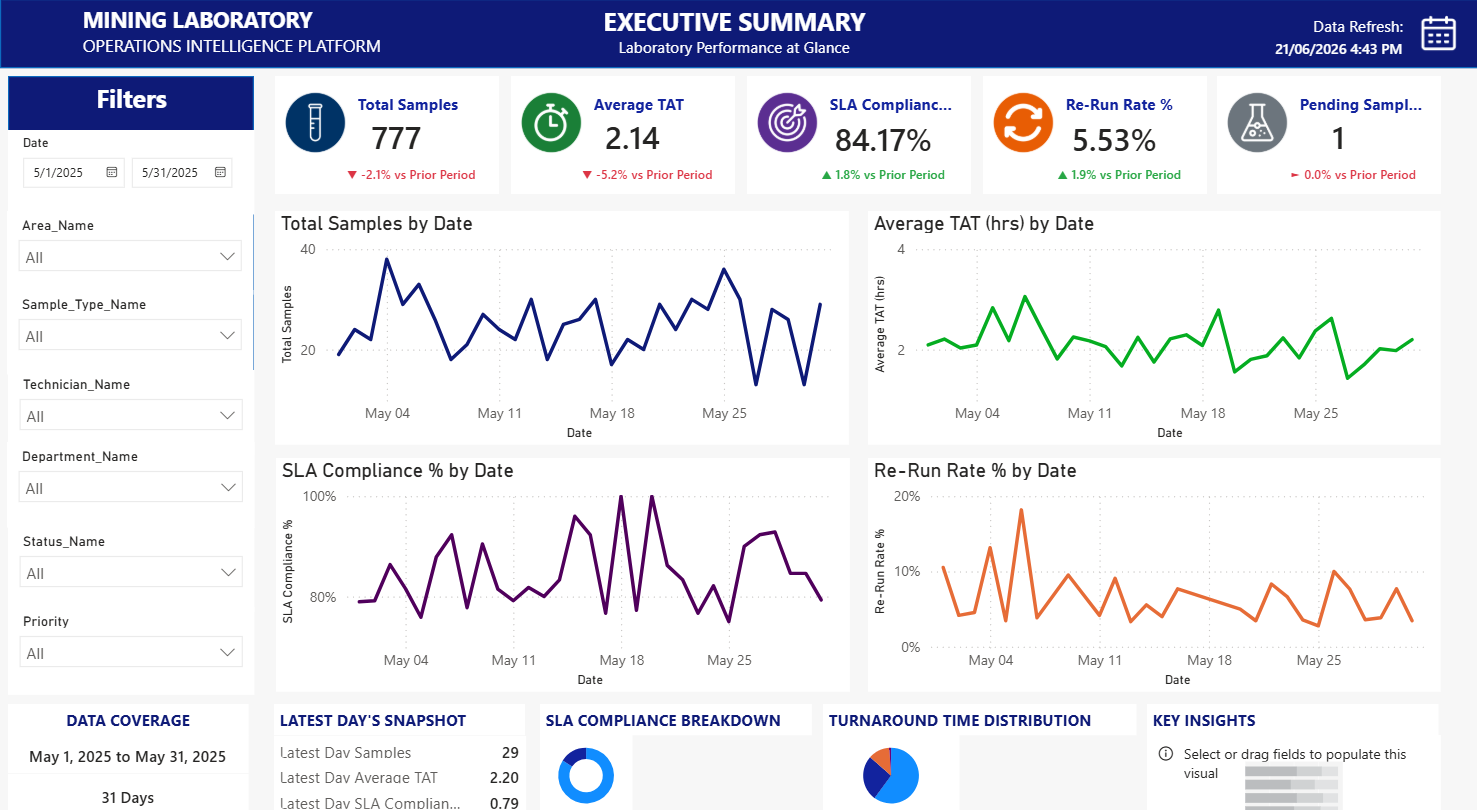
The dashboard gives leadership a single view of sample volume, turnaround time, SLA performance, re-run activity, late samples, lab health, and lateness severity. Filters allow users to review performance by date, area, department, sample type, status, and technician.
Total Samples
Avg TAT Hours
SLA Compliance
Late Samples
Dashboard
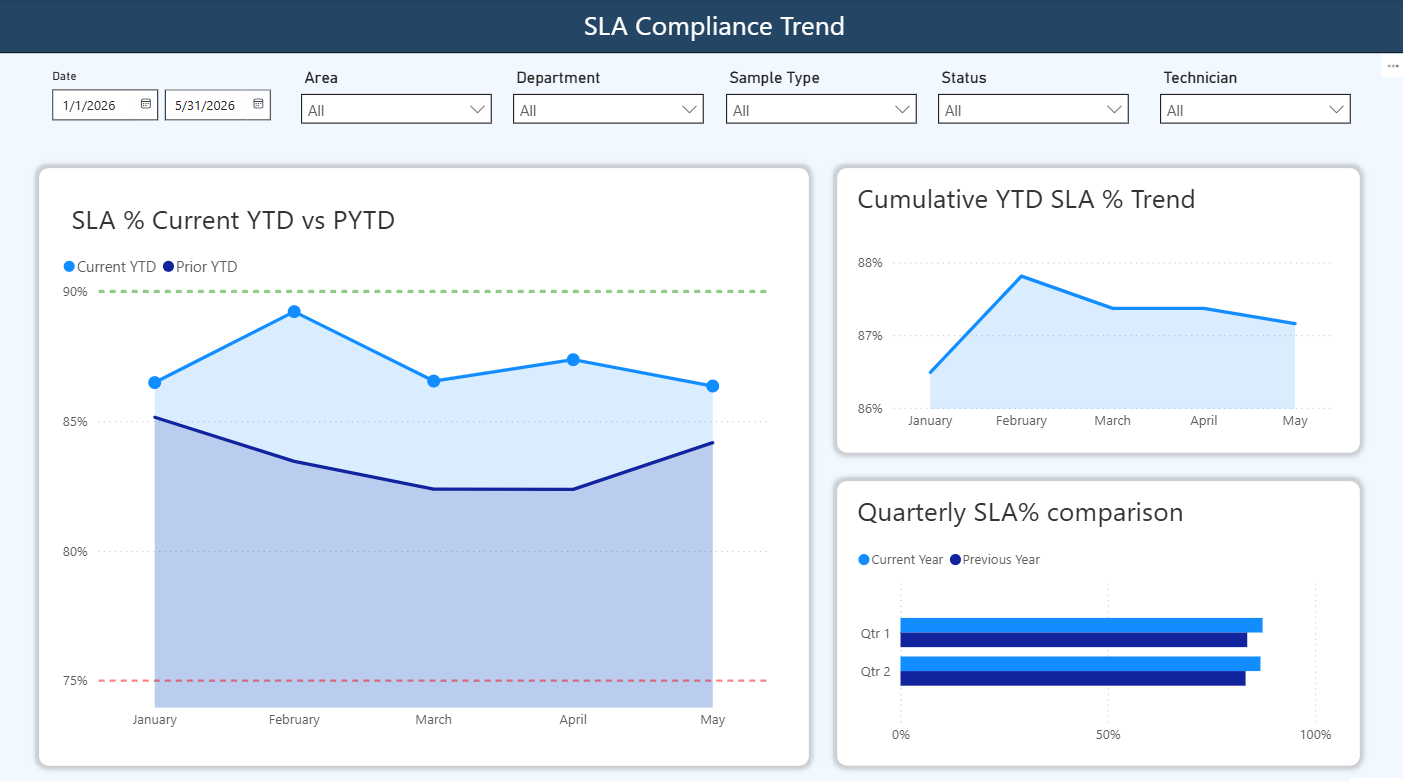
Additional dashboard views allow leadership to evaluate SLA performance trends, compare current-year performance against prior-year results, and identify whether operational performance is improving or deteriorating over time.
Key Findings
May received 916 samples against a normalized YTD expectation of 908.04, meaning workload was essentially flat. Despite that, average turnaround increased 8.88%, SLA compliance declined 1.01 percentage points, and late samples increased 8.98%.
Rush samples and re-run samples were effectively flat against normalized YTD expectations, making demand mix an unlikely explanation.
XRF-1 and XRF-2 handled approximately 62% of May volume and both experienced double-digit increases in average turnaround.
The Smelter department handled nearly 58% of May volume and degraded across turnaround, SLA compliance, and late sample count.
Deliverables
These documents demonstrate the full engagement lifecycle: kickoff, progress communication, and executive findings.
PDF Document
Defines the problem, objectives, scope, deliverables, risks, assumptions, schedule, responsibilities, and communication plan.
PDF Document
Shows completed work, project status, blockers, decisions needed, planned next work, and hours.
PDF Document
Summarizes KPI movement, bottleneck signals, operational risks, root cause hypotheses, and recommended actions.
Process
Demonstrated Value
This case study demonstrates how an operations-heavy business can move from scattered sample records to a structured management reporting system. The final deliverables provide leadership with visibility into workload, turnaround performance, SLA compliance, re-runs, late samples, bottleneck signals, and follow-up actions.